
May 2017 RE/MAX National Housing Report
The May 2017 RE/MAX National Housing report is based off the April 2017 Sales Data Reported. The brisk start to the 2017 home-selling season bogged down in April with home sales dropping 4.1% below March and 4.5% below the previous April.
January 2017 RE/MAX National Housing Report
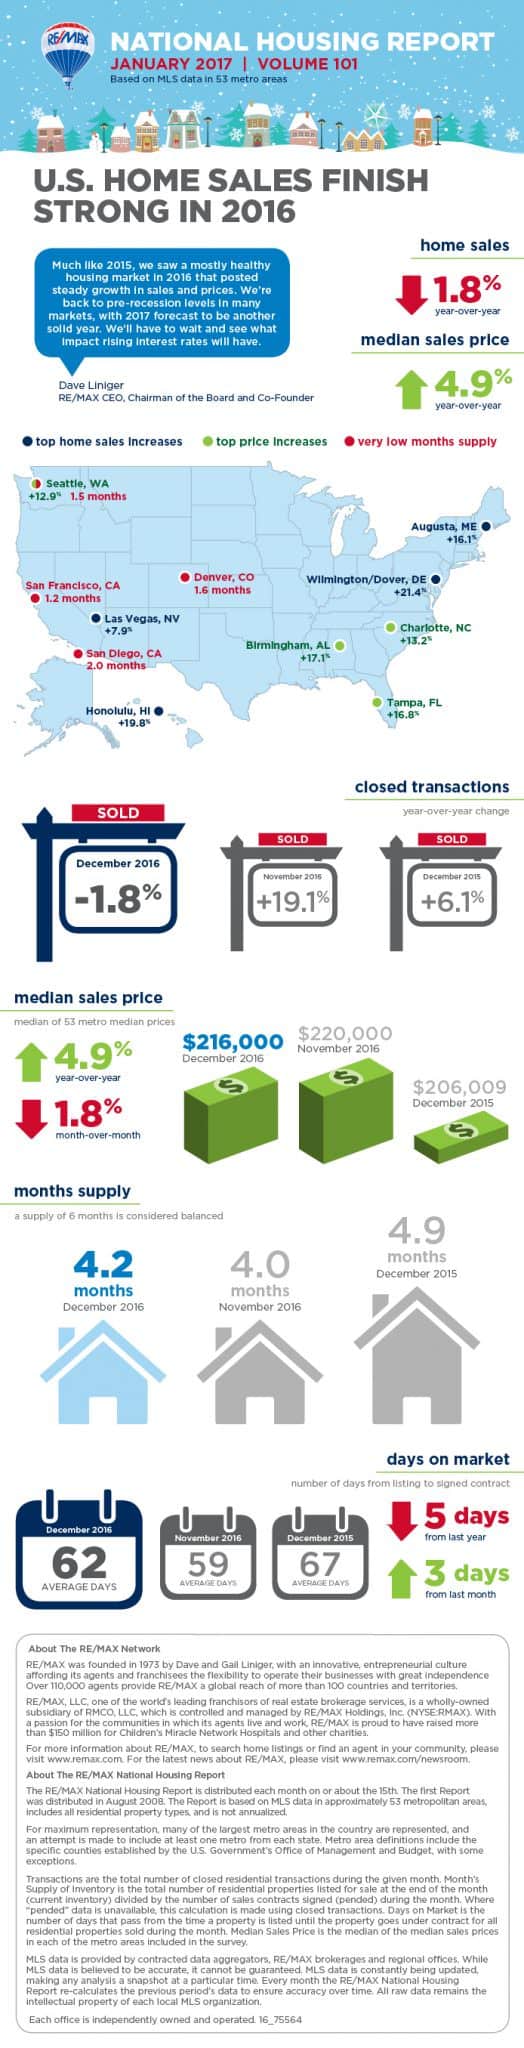
Capped off by way of a strong December, 2016 was the very best year for U.S. home sales ever since the recession, based on the January 2017 RE/MAX National Housing Report. Home sales in 2016 were the greatest in the housing report’s eight-year history, topping the sales of 2015, the previously strongest year. Nine months […]
December 2016 RE/MAX National Housing Report
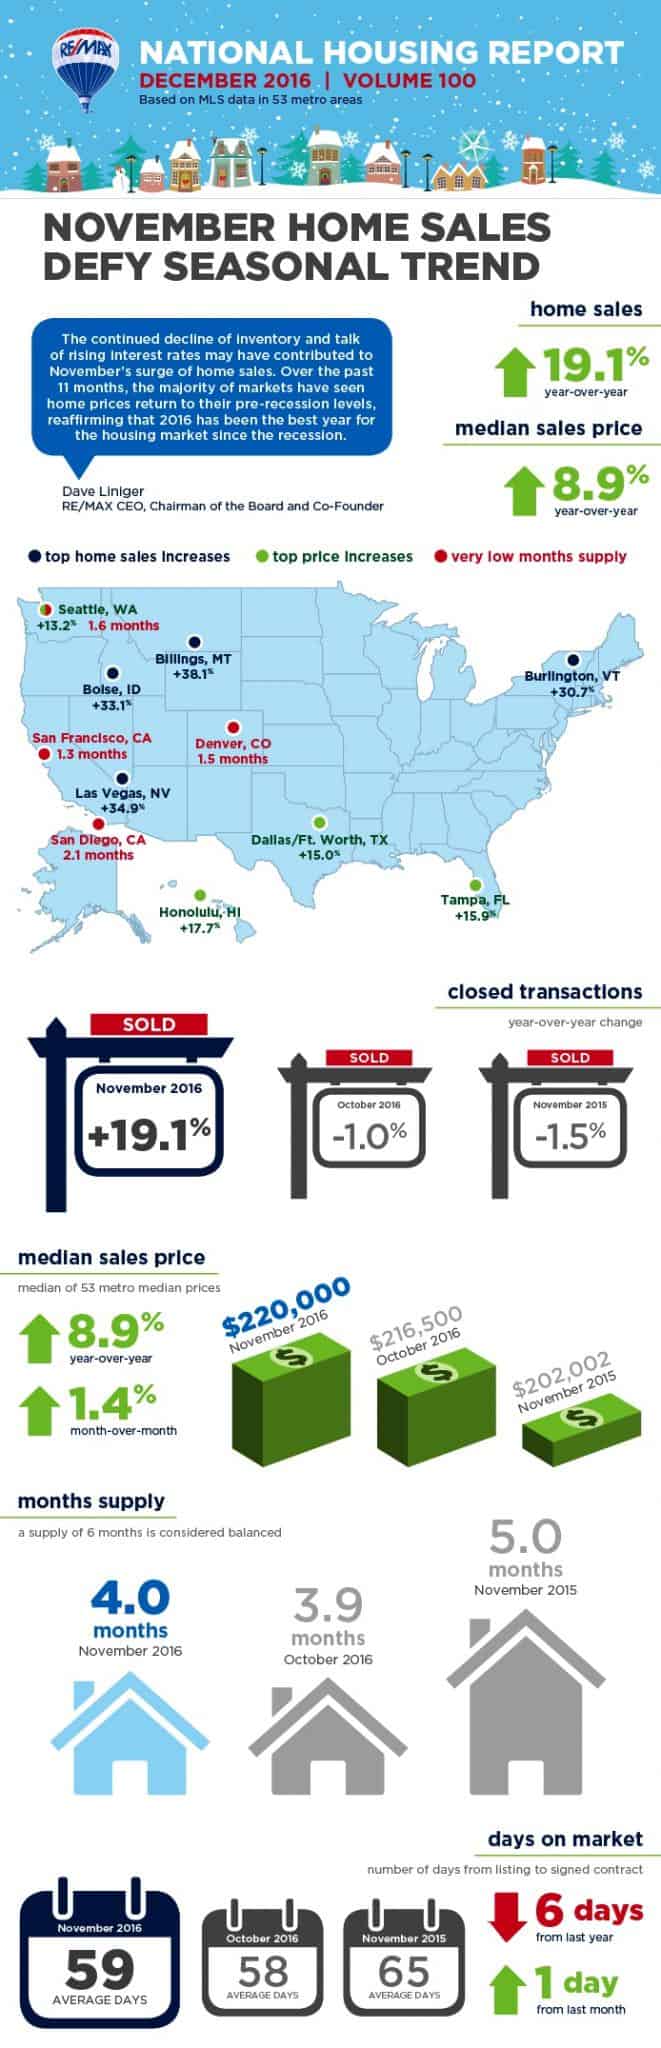
The December 2016 RE/MAX National Housing Report utilizes the sales from November and the November Home Sales Defied the Seasonal Trend Despite the typical winter slowdown, November home sales finished 19.1% above a year ago and prices increased 1.4% over October. All but one of the 53 markets within the RE/MAX National Housing Report posted […]
April 2016 National Housing Report
The 2016 home buying season began in March with a 33.4% jump in sales from February among the 53 metro areas surveyed for the RE/MAX National Housing Report, which is a little better than the 31.0% seven-year average of February to March increases. March sales were also 3.6% greater than sales one year ago. So […]
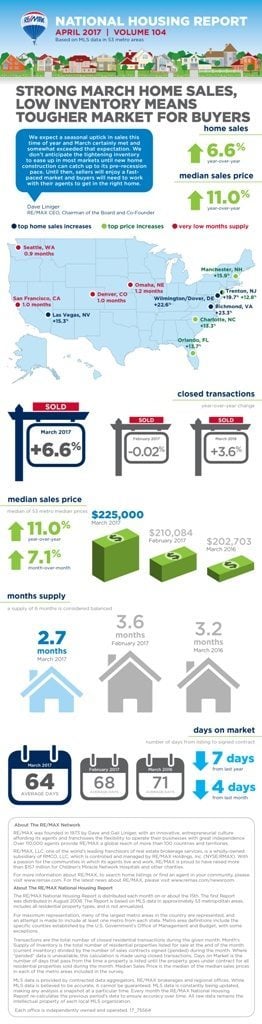
March National Housing Report: What the Numbers Mean for You
In this month’s National Housing Report, we will go over what the numbers mean to you. Although home price increases seem to be declining, this market can certainly still feel crazy in metro areas with high demand. However, many metro areas are seeing double digit increases in median housing prices over a year ago, including […]